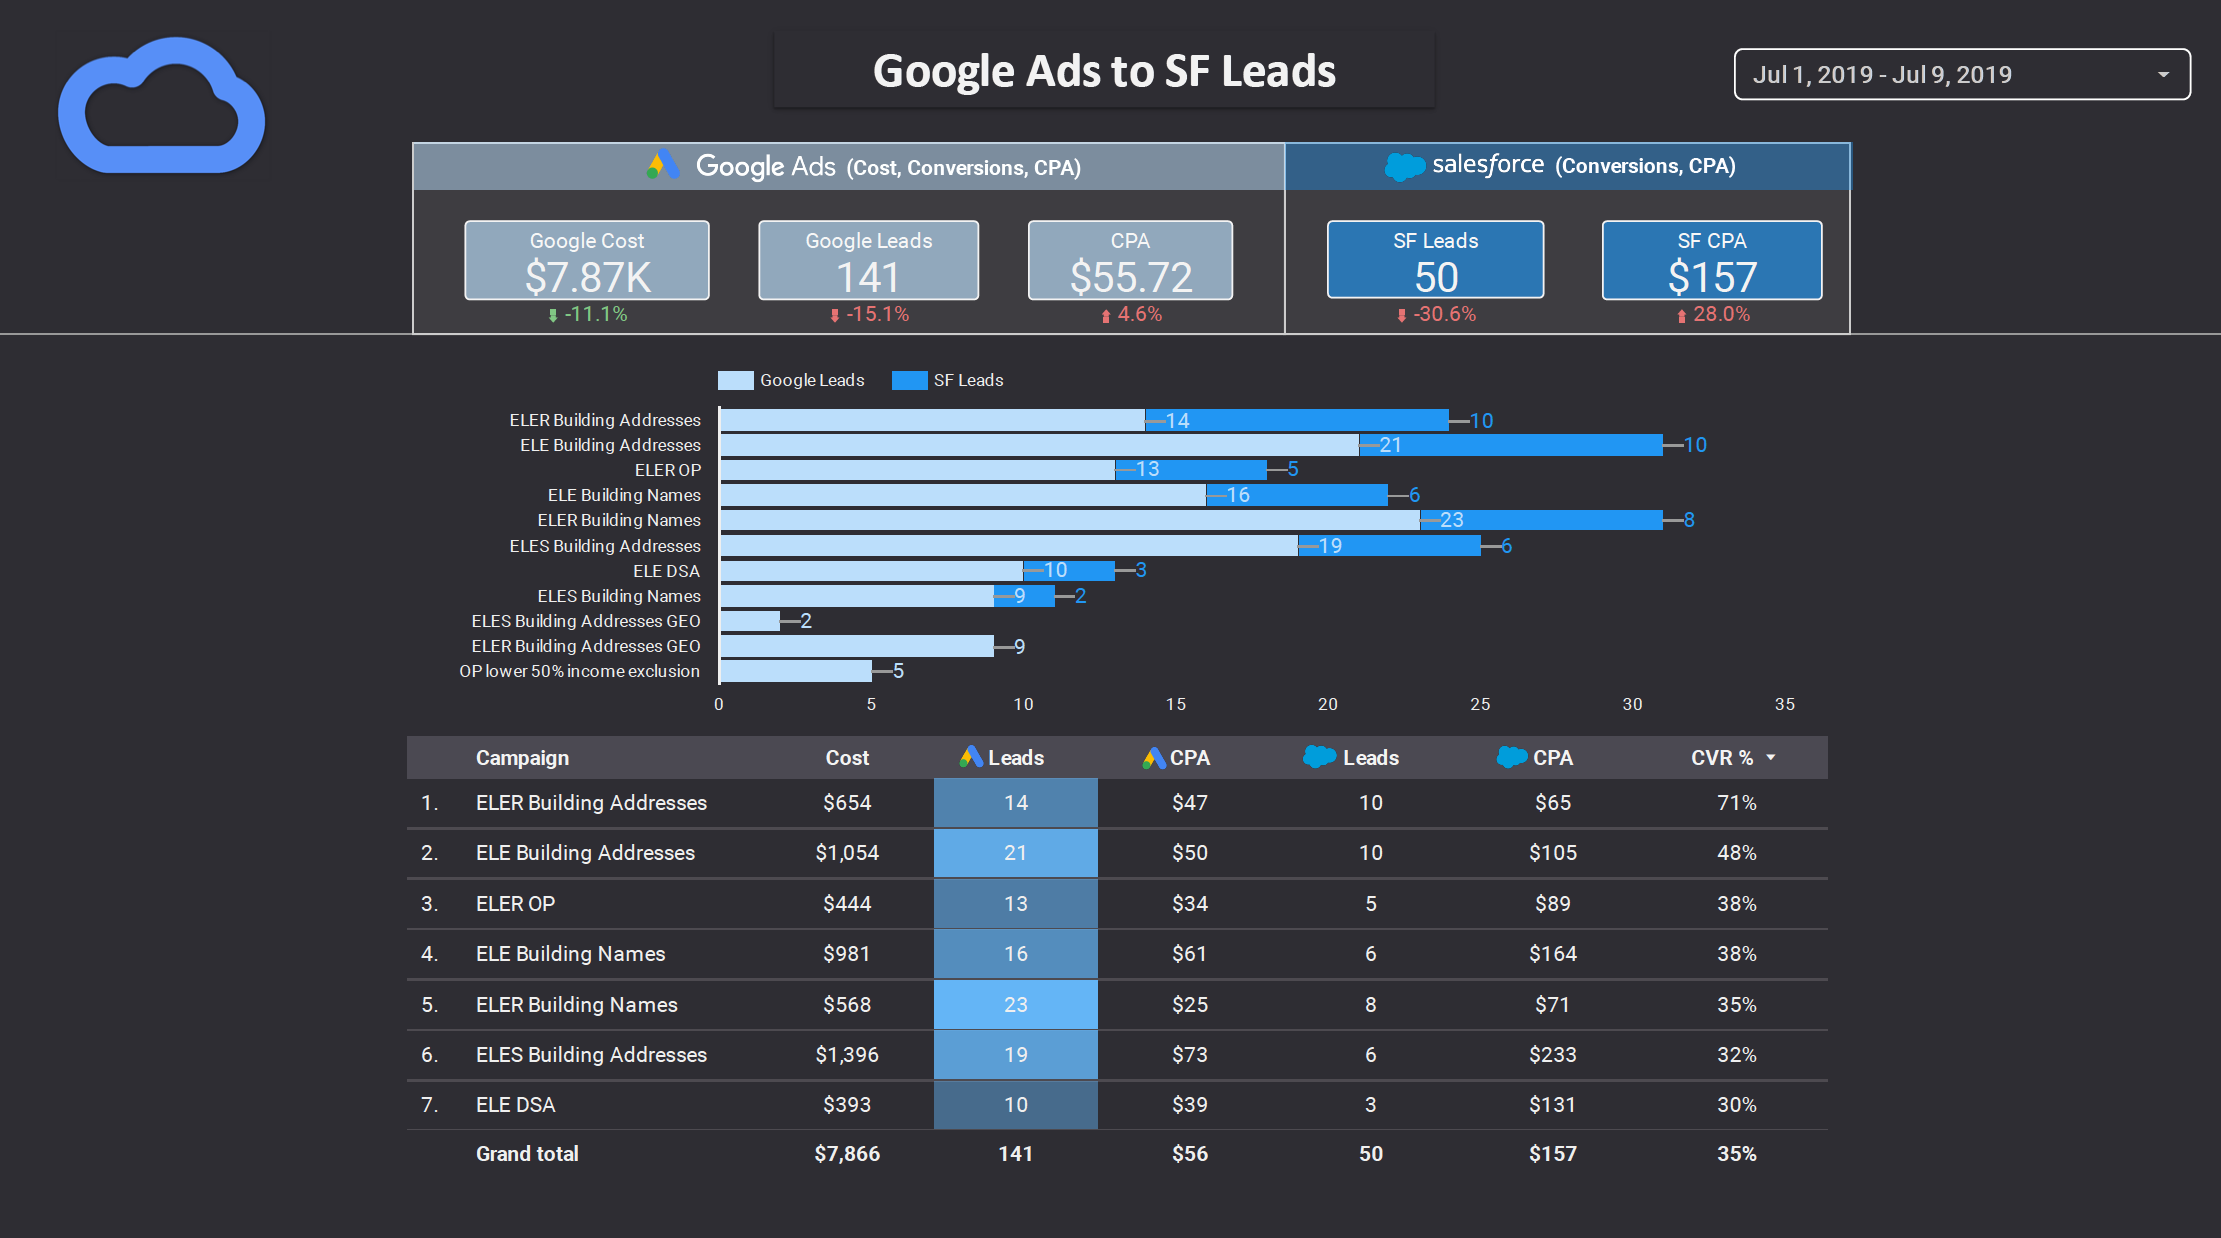
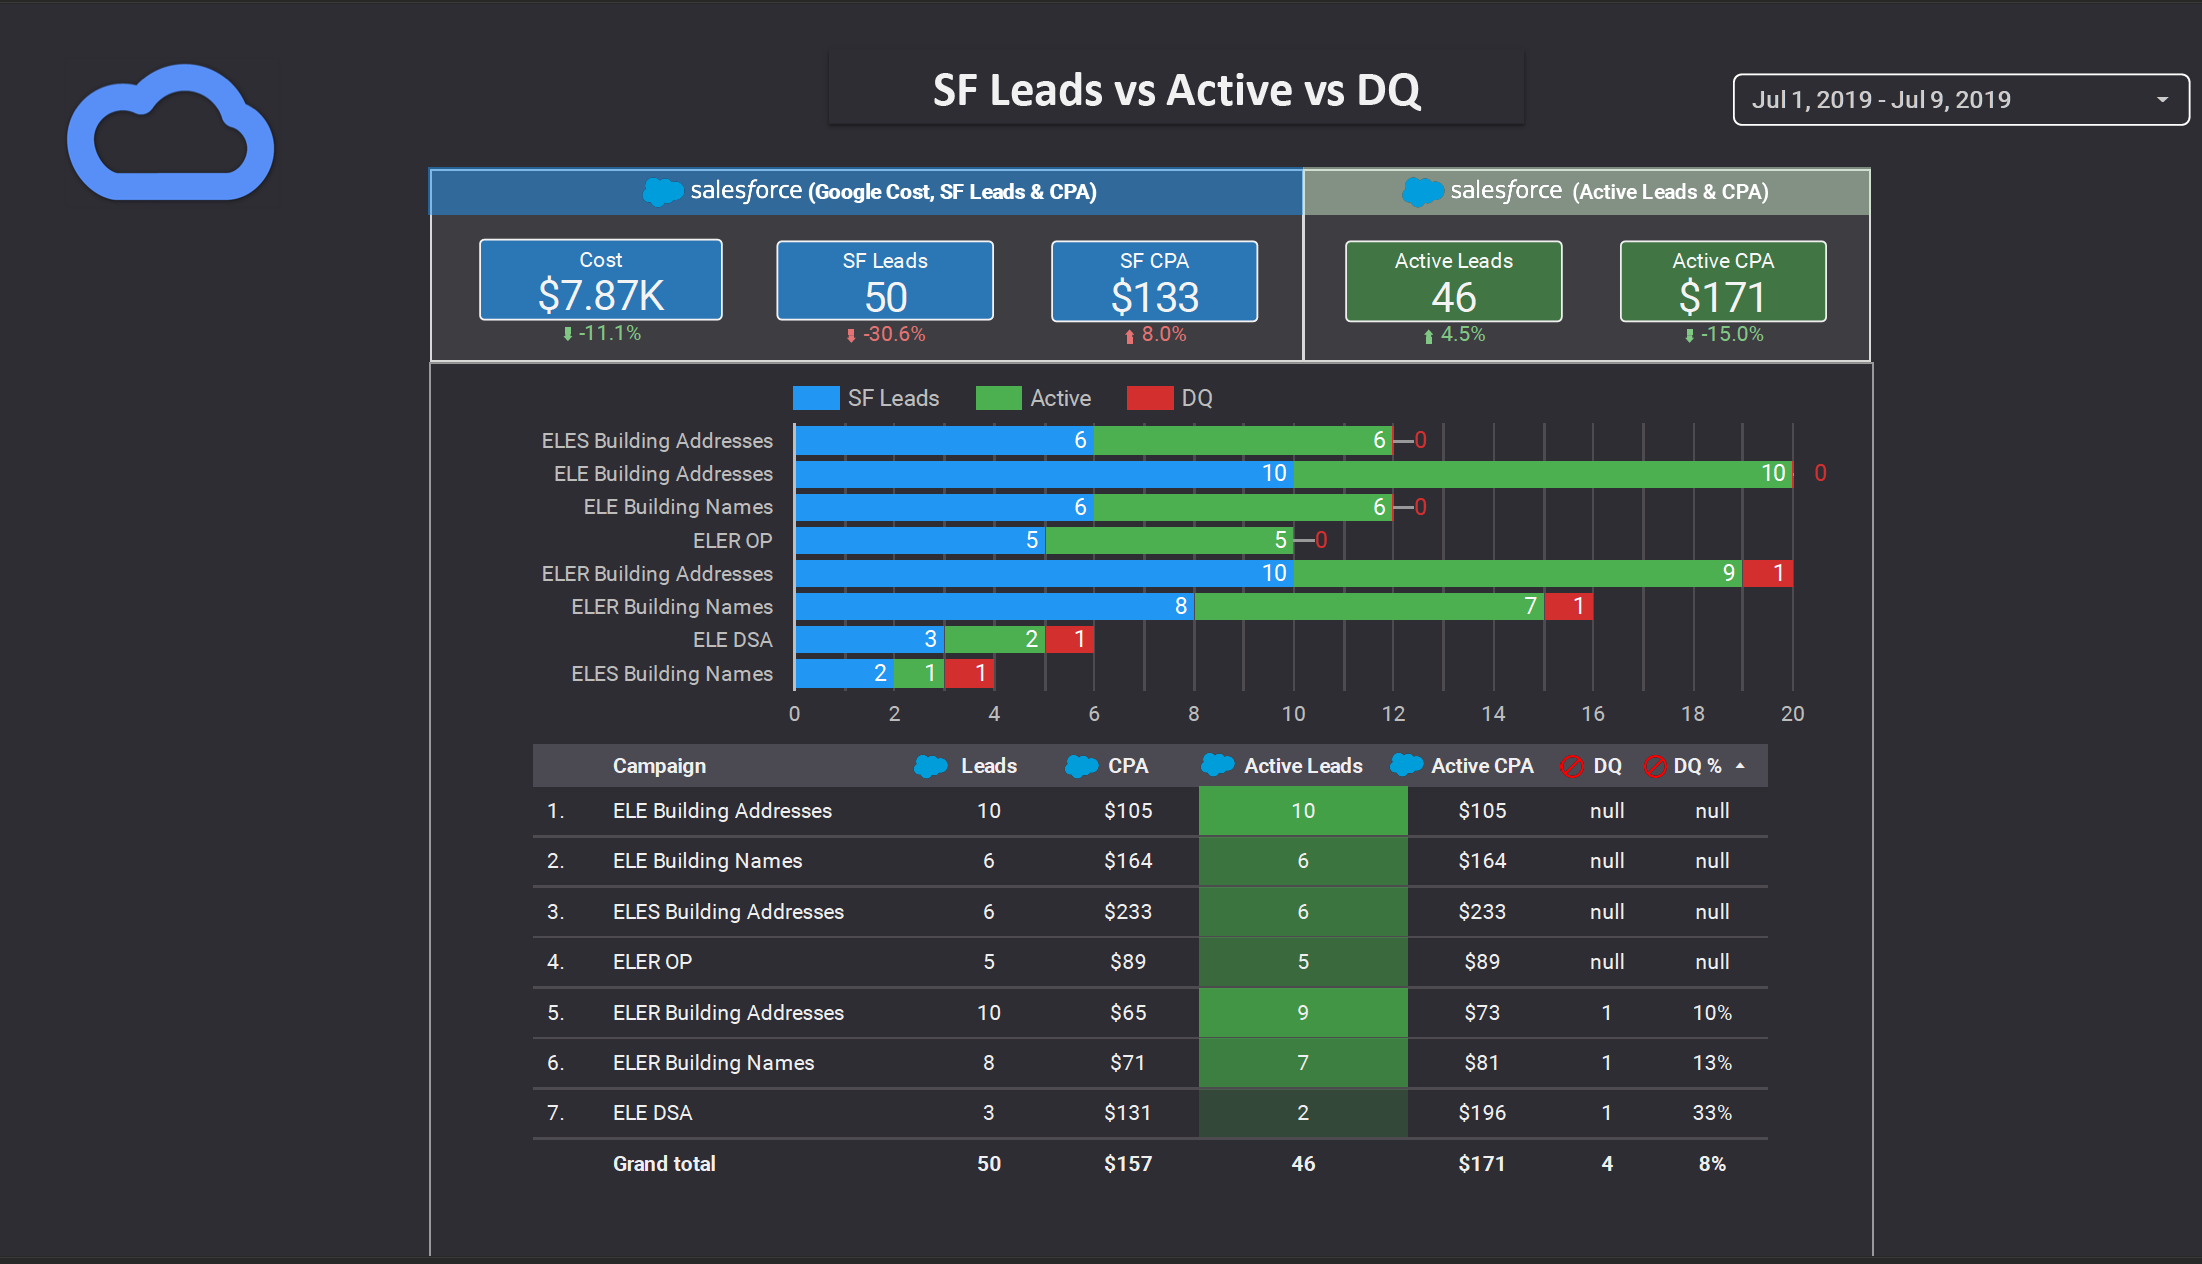
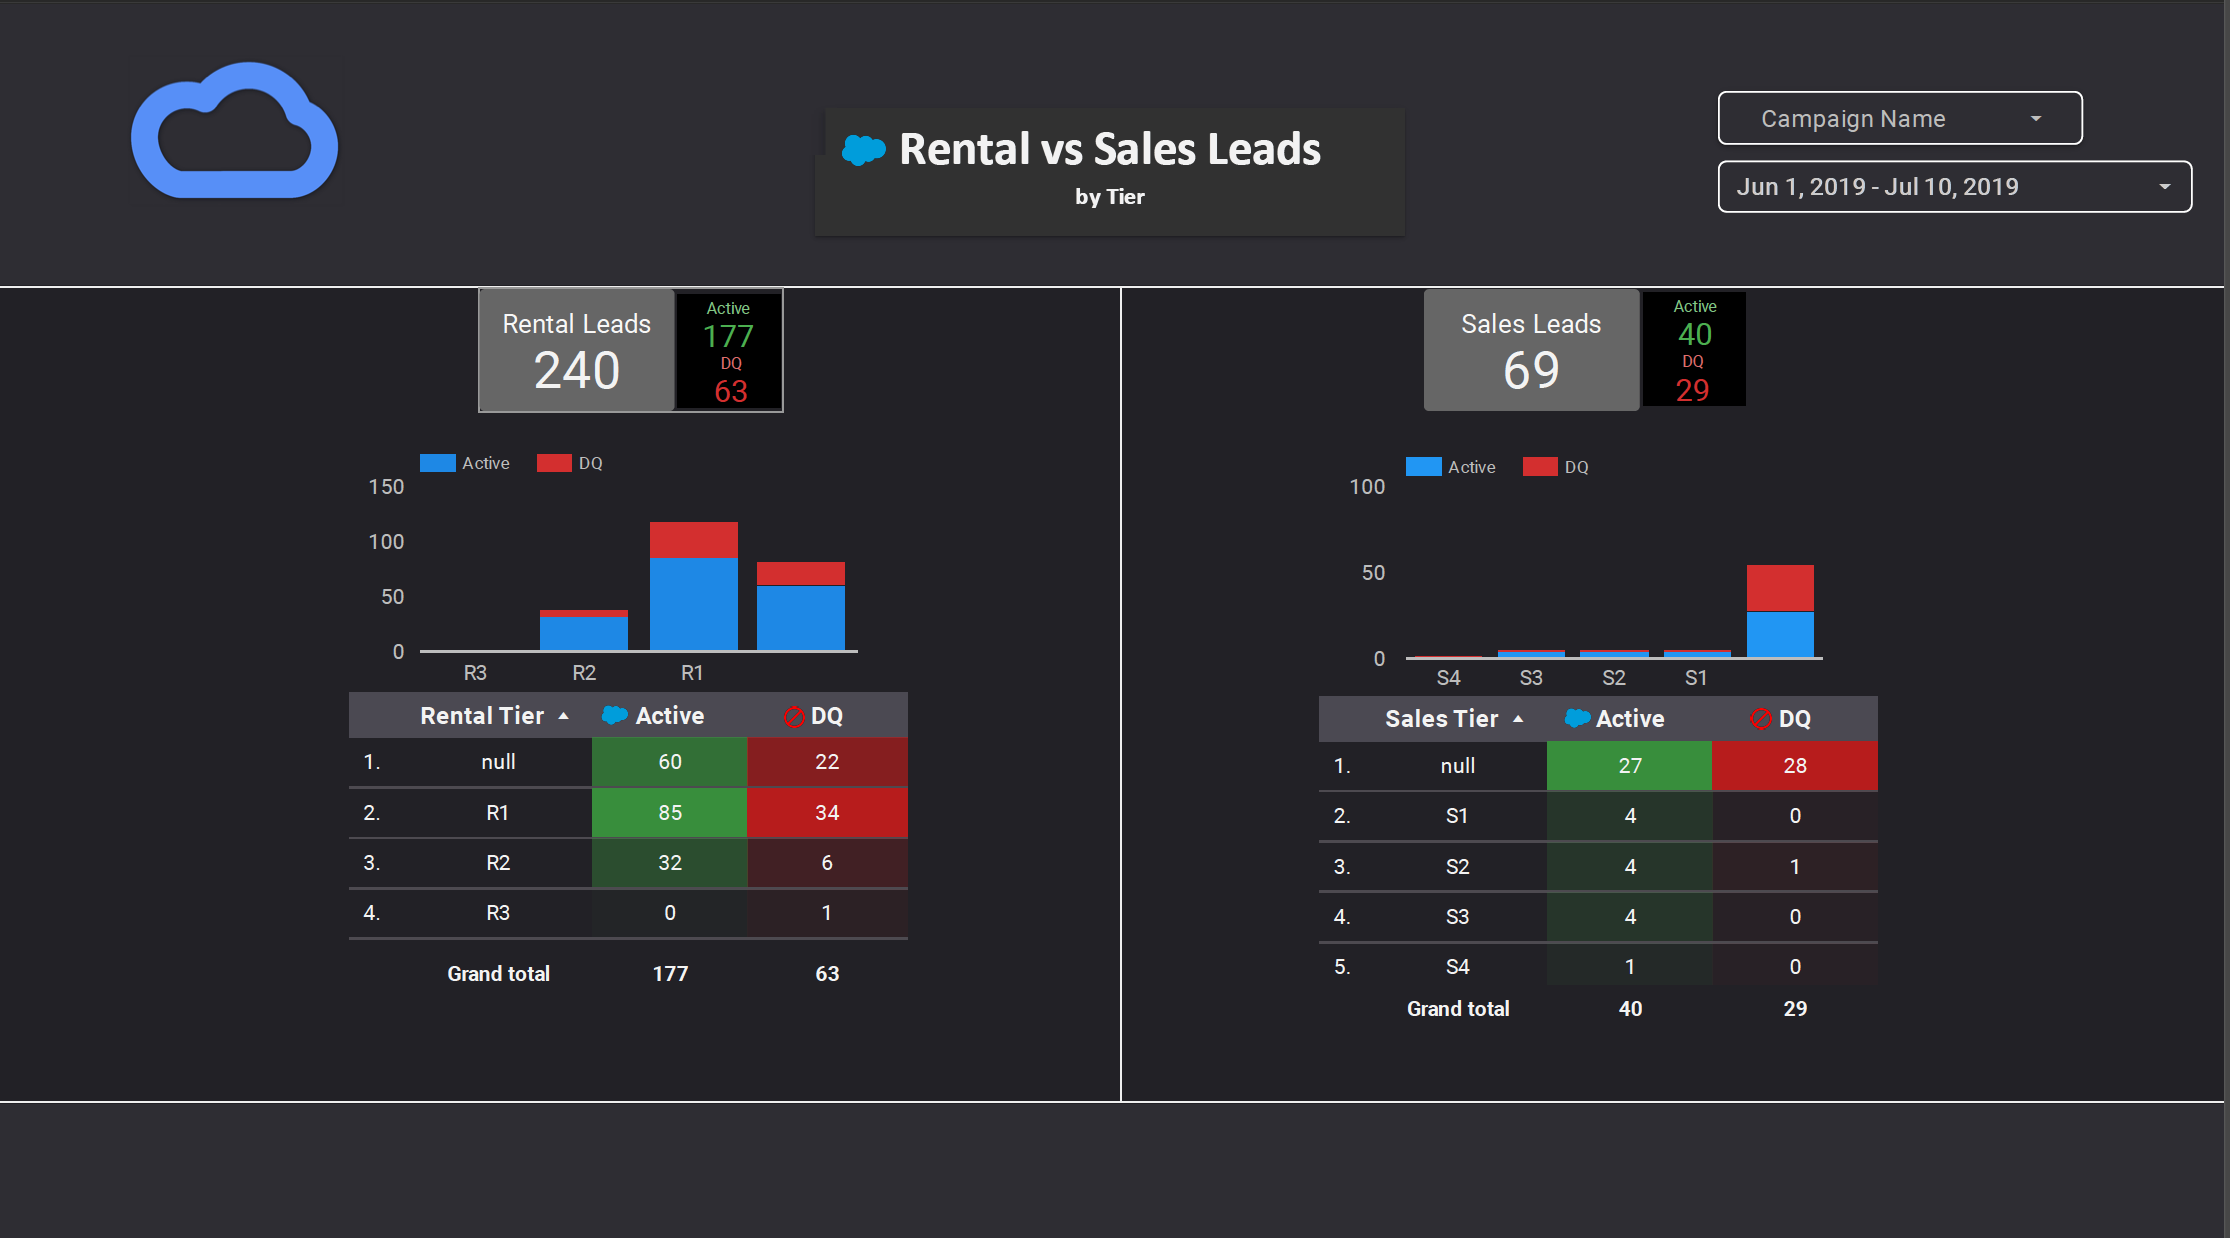
Forcery designs custom dashboards using Google Data Studio, Tableau CRM, B2B Marketing Analytics, Power BI and more. Connecting data sources ranging from Google Analytics to Facebook to Salesforce, Forcery develops powerful data visualizations to make strategic business decisions in real time.
From custom dimensions and metrics for custom Google Analytics, to creating events and tags in Google Tag Manager (GTM), to bringing all of the data from analytics, performance marketing and CRM systems into a data visualization or business intelligence (BI) tool, Forcery has been making beautiful sense of data for over a decade.
Click to see how Forcery incorporates Google Analytics, Google Ads, Facebook and Sales Cloud information in a single business intelligence tool Google Data Studio, demystifying the entire marketing to sales to deal pipeline.
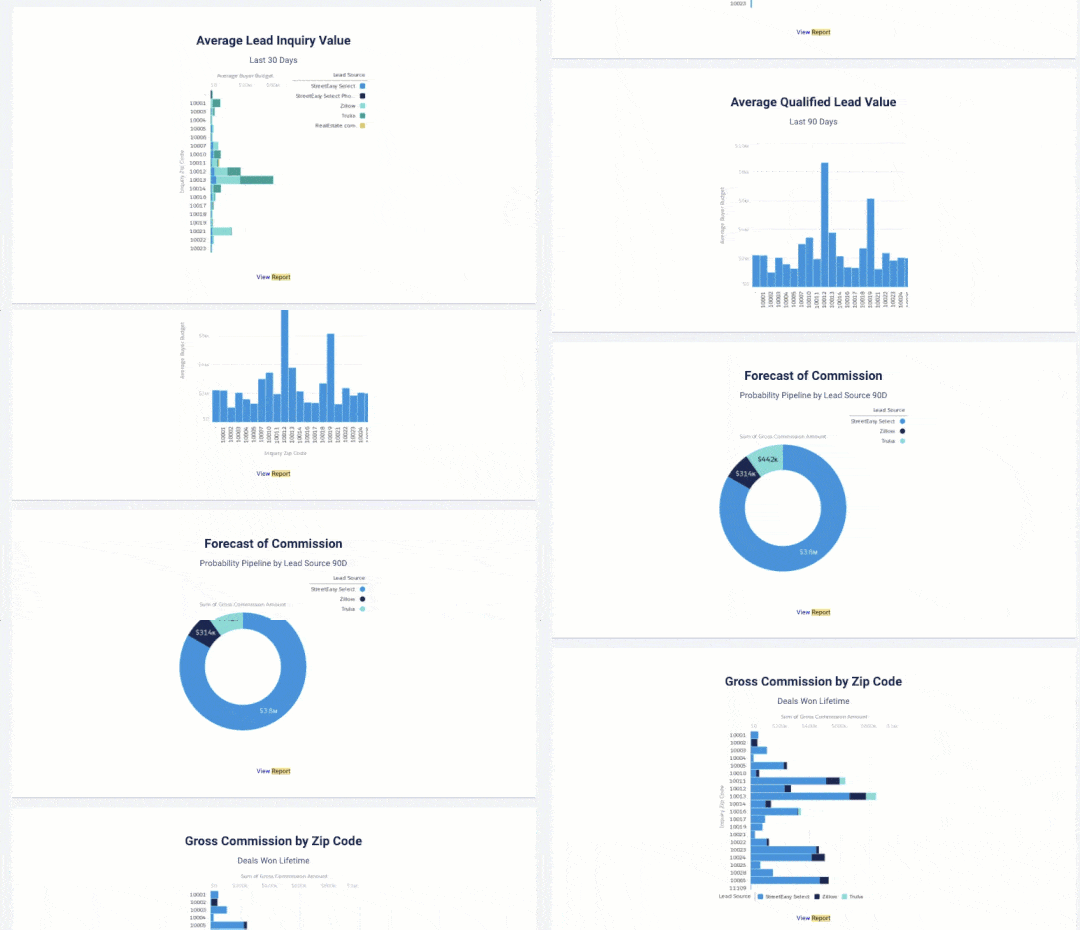
Click to learn how standard Salesforce Lightning Report Builder is capable of incredible data visualization. The data is not only compiled and modeled, but Salesforce reports may be run on a schedule over relative dates (say the rolling last 30 days), and automatically distributed via email to executive teams:
Even something as simple as creating a custom dimension in Google Analytics for hourly goal traffic becomes crucial for time of day bid adjustments in conversion optimization:
